The Color Map Tab
This tab is used tune the coloring of the model. It is populated only if the model is colored (either by a certain variable or solid color). It is useful when you want to customize the corresponding colors of the dataset.
Lock Data Range: fix the data range so that it will not be adjusted by the filters
Interpret Values As Categories: switch the color functions to categorical color mode
Rescale On Visibility Change: adjust the color map with the model visibility
Mapping Data
When “Interpret Values As Categories” is not checked, this section will appear for the user to manually assign a color to a certain value of the data. The user can specify as many color points as needed. Interpolation will be done for the other values.
In the figure below, color has been assigned at 8 individual data points.
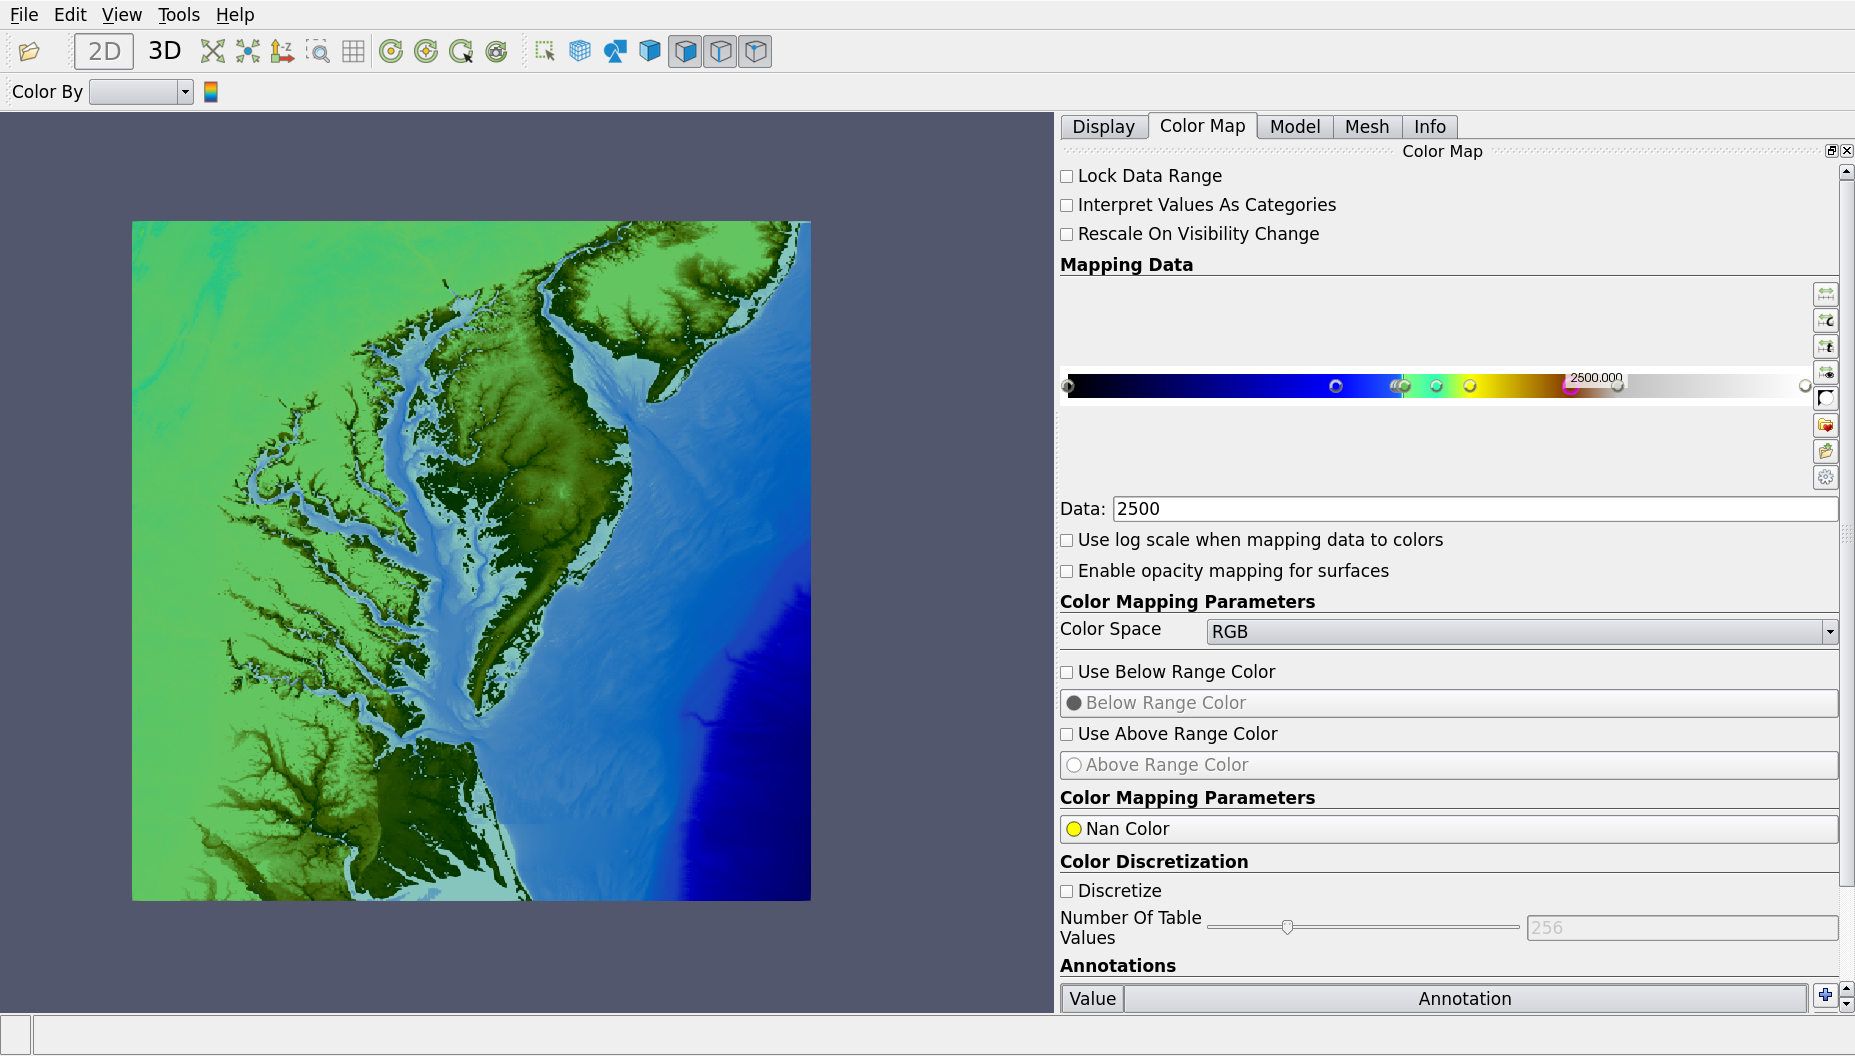
To add a point, left-click on the color bar. To edit the color of a point, double-click it. To remove a point, middle-click it. Click and drag any point to move its location. Data values can be inputted into the “Data” field below the color bar. The contour will be changed accordingly after the mapping data is modified.
There are various options on the right side of the color bar including:
Rescale to data range: To scale to the color bar’s minimum and maximum values to the min/max of your dataset.
Rescale to custom range: Instead of mapping the range of color to the range of dataset linearly, you can also apply a custom range.
Rescale to data range over all time steps: For data with multiple time steps, the min/max range can be set the the dataset’s min/max range among all the time steps.
Rescale to visible range: Rescale to the range of the visible portion of the model.
Rescale to transform functions: Rescale using the transform functions.
Choose preset: Some color maps are available in ModelBulder for the user.
Save to preset: The current color map can be saved as a preset.
Manually edit transform function: This adds a new table below the color bar, which shows all the entries in the color map for the user to manually edit.
You can check “Use log scale when mapping data to colors” if the original datasets are scaled logarithmically.
Alpha values can be mapped onto elements as well if “Enable opacity mapping for surfaces” is checked
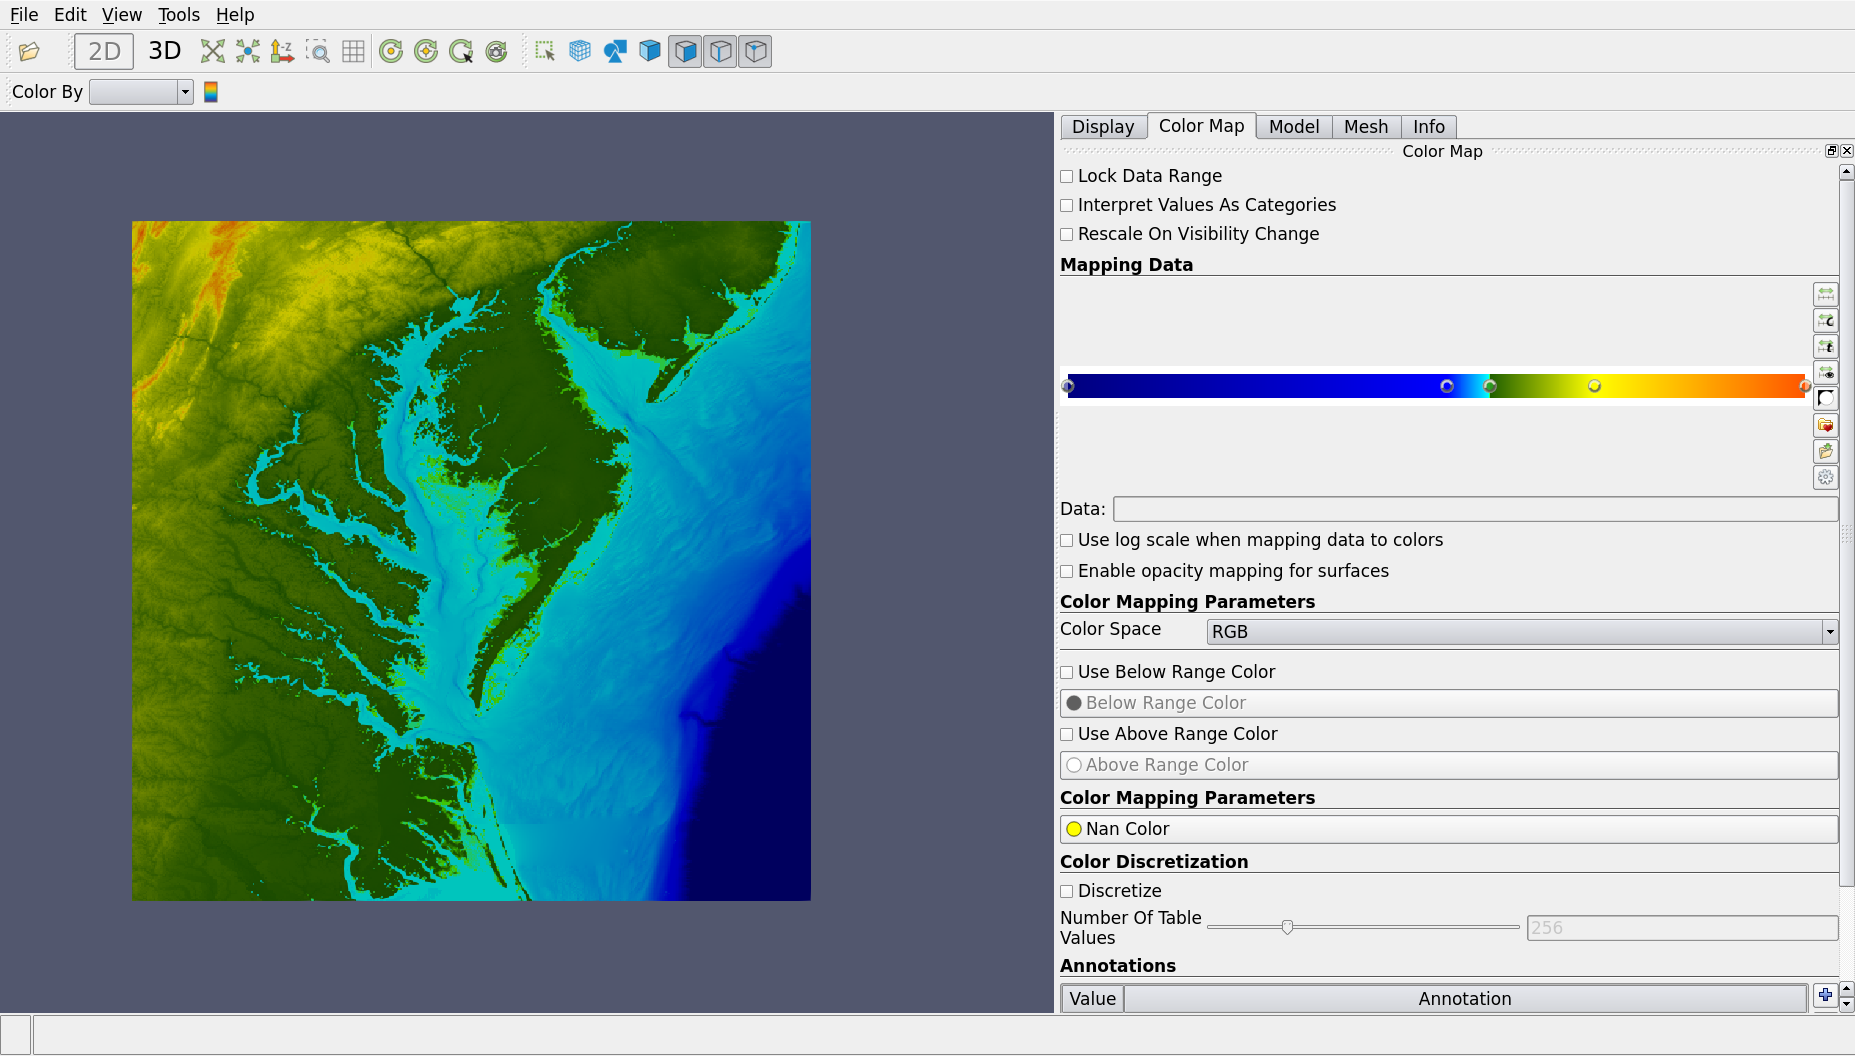
Here is the same dataset using another preset color map:
Color Mapping Parameters
Color Space: The color space {RGB, HSV, Lab, Diverging} that the color values are mapped from. Notice how changing the color space changes the mapping:
RGB 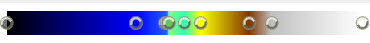
Diverging 
Use Below Range Color/Use Above Range Color: manually assign a color when the data value is below/above the range
Nan Color: default color for elements of non-numeric values
Color Discretization
Discretize: whether or not to pick colors from a discrete set
Number of Table Values: the number of colors to discretize by
Annotations
This is a table to annotate the color mapping.